Such surges in energy use can overload the existing grid capacity, meaning the electricity grid might be unable to supply adequate power to meet demand at certain times. This can lead to power outages (downtime), voltage fluctuations, or other undesirable scenarios.
For businesses, this could lead to significant issues, as they might be unable to support their operations, potentially having to halt their production processes due to power cuts. Moreover, expanding the grid capacity can be challenging, often accompanied by infrastructure investments and the need for regulatory approvals.
Use of Artificial Intelligence
To forecast the energy consumption of a telecom location, Allinq established an analytical model based on (linear) regression. This model determines the relationship between two variables: the annual energy consumption of a telecom site, and the (predicted) weather data from a nearby KNMI station. Various weather-related variables, such as temperature, sunlight hours, and humidity, are incorporated into the model. In addition to weather-related factors, building-related variables, like the prior day’s consumption, are also included.
Two models were utilized for training: a machine learning (ML) model (Random Forest) and a deep learning (DL) model (LSTM). The ML model is suitable when limited data is available, while the DL model, although more powerful, requires a more extensive dataset to prevent overfitting.
A Random Forest model is an “ensemble method” where multiple models (in this case, decision trees) are used to ultimately give a prediction. Random Forests often excel at modeling complex signals. An LSTM model, a type of neural network, leverages a unique architecture suitable for modeling sequential data, such as a building’s energy consumption over time. For this reason, and its capacity to handle complex data, this model was chosen.
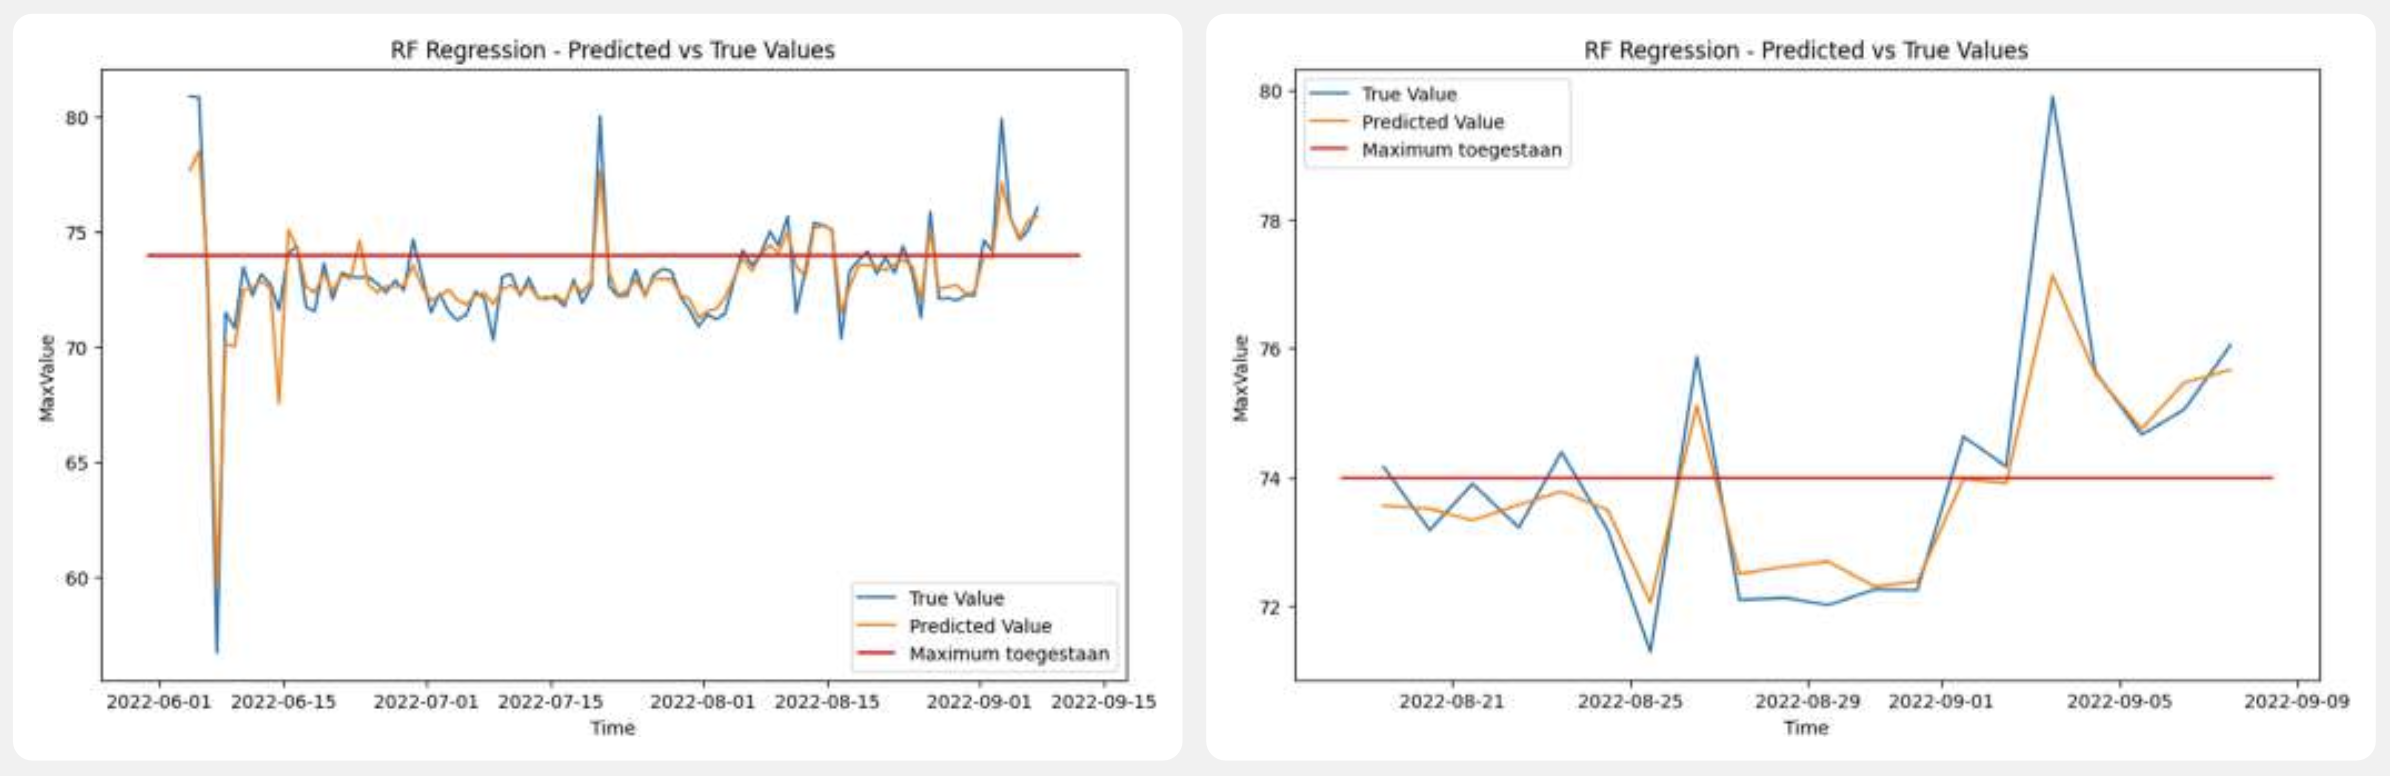
The dataset is divided into training and test datasets. ML/DL determines the impact of various weather/building-related variables on energy consumption. After training, the model is evaluated on the test dataset to ascertain if the energy consumption pattern learned is accurate. The evaluation also determines which model — ML or DL — is better suited for predicting energy consumption. Once the energy consumption is predicted with sufficient accuracy, the model can be deployed. The site manager can then be promptly informed when the grid capacity, indicated by the red line in Figures 1 and 2, is likely to be exceeded.
What challenge does it address?
Most assets managed by telecom companies show nearly consistent energy consumption when behavior remains unchanged. Peaks in energy use are primarily caused by cooling systems. The variability of external temperature influences these systems’ cooling capacity. Given the strong correlation between the energy use of these cooling systems and weather conditions, it’s feasible to predict these power surges using weather forecasts.
Conclusion
By predicting and analyzing consumption, companies can discern which locations under their management might exceed grid capacity in the coming days. Consequently, managers can take timely action at these risk sites, perhaps by adjusting the cooling systems’ settings or temporarily running them on a UPS or backup generator. In this way, companies can avoid unnecessary expenses and disconnections by the grid operator. Such predictions enable a proactive approach.
More information
For further information, contacts, or more projects of this kind, please refer to the Energy and Sustainability Working Group. For this, visit:
- The Community Platform (for participants)
- Or the website page (for non-participants)